
Leeds recorded an infection rate of 1,105.1 new cases per 100,000 people in the seven days to January 23, down 9.1 per cent from the previous week.
That's above the UK average of 954.2 cases per 100,000 people.
Infection rates vary across Leeds and some neighbourhoods have seen cases fall faster than others in the latest week of data.
Here are the Leeds areas which saw the biggest drop in infection rates in the seven days to January 23. All images are for illustrative purposes.
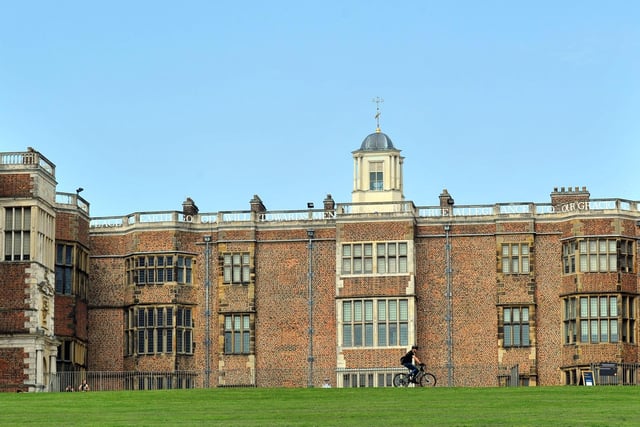
1. Temple Newsam & Graveleythorpe
Temple Newsam & Graveleythorpe had 613.4 cases per 100,000 people in the seven days to January 23. That’s down 44.3% from the previous week.
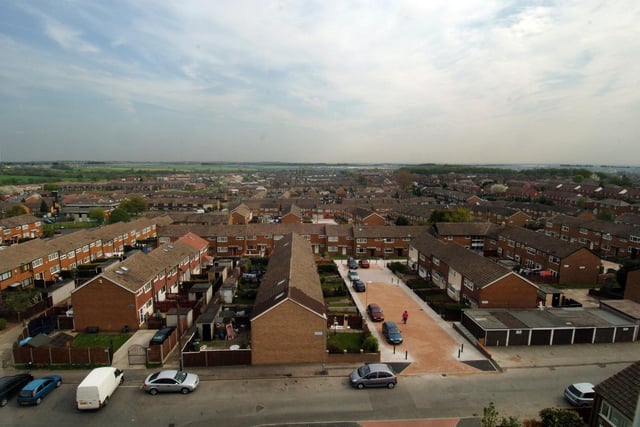
2. Whinmoor
Whinmoor had 912.8 cases per 100,000 people in the seven days to January 23. That’s down 39% from the previous week.
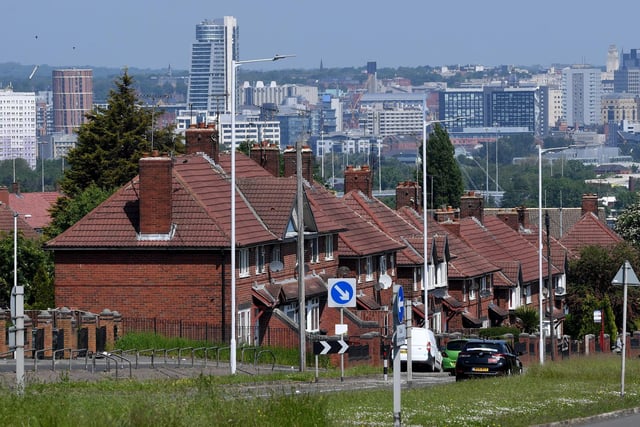
3. Belle Isle South
Belle Isle South had 1,130.4 cases per 100,000 people in the seven days to January 23. That’s down 38.1% from the previous week.
4. Morley Bruntcliffe & Woodkirk
Morley Bruntcliffe & Woodkirk had 1,202.3 cases per 100,000 people in the seven days to January 23. That’s down 37.4% from the previous week. Photo: Google
5. Collingham, Rigton & Harewood
Collingham, Rigton & Harewood had 992 cases per 100,000 people in the seven days to January 23. That’s down 36.2% from the previous week.
6. Cross Gates East & Manston
Cross Gates East & Manston had 701 cases per 100,000 people in the seven days to January 23. That’s down 35.5% from the previous week.